Proof of Work

1.3 million users, one GA4 view: reading a Gulf e-commerce property at scale

What one year of a single analytics property shows about audience scale, markets and channel mix, and the revenue figure GA4 reported, read with its limits.

My roleMarketing and analytics for this property planned, run and read end to end by Mo…
PlatformsGA4
Evidence period2023-01-01 → 2024-01-01
Evidence items1
The takeaway for

A year of traffic at this scale was readable in one view: where it came from, which markets carried it and what GA4 reported in revenue. The next question is margin, not volume.

The numbers at a glance

Audience and scale1.3MUsers
Audience and scale1.3MNew users
Audience and scale21sAverage engagement time
Analytics-reported revenue$7.2MGA4-reported total revenue

Evidence

Client, account and campaign identifiers are irreversibly redacted. Originals stay private.

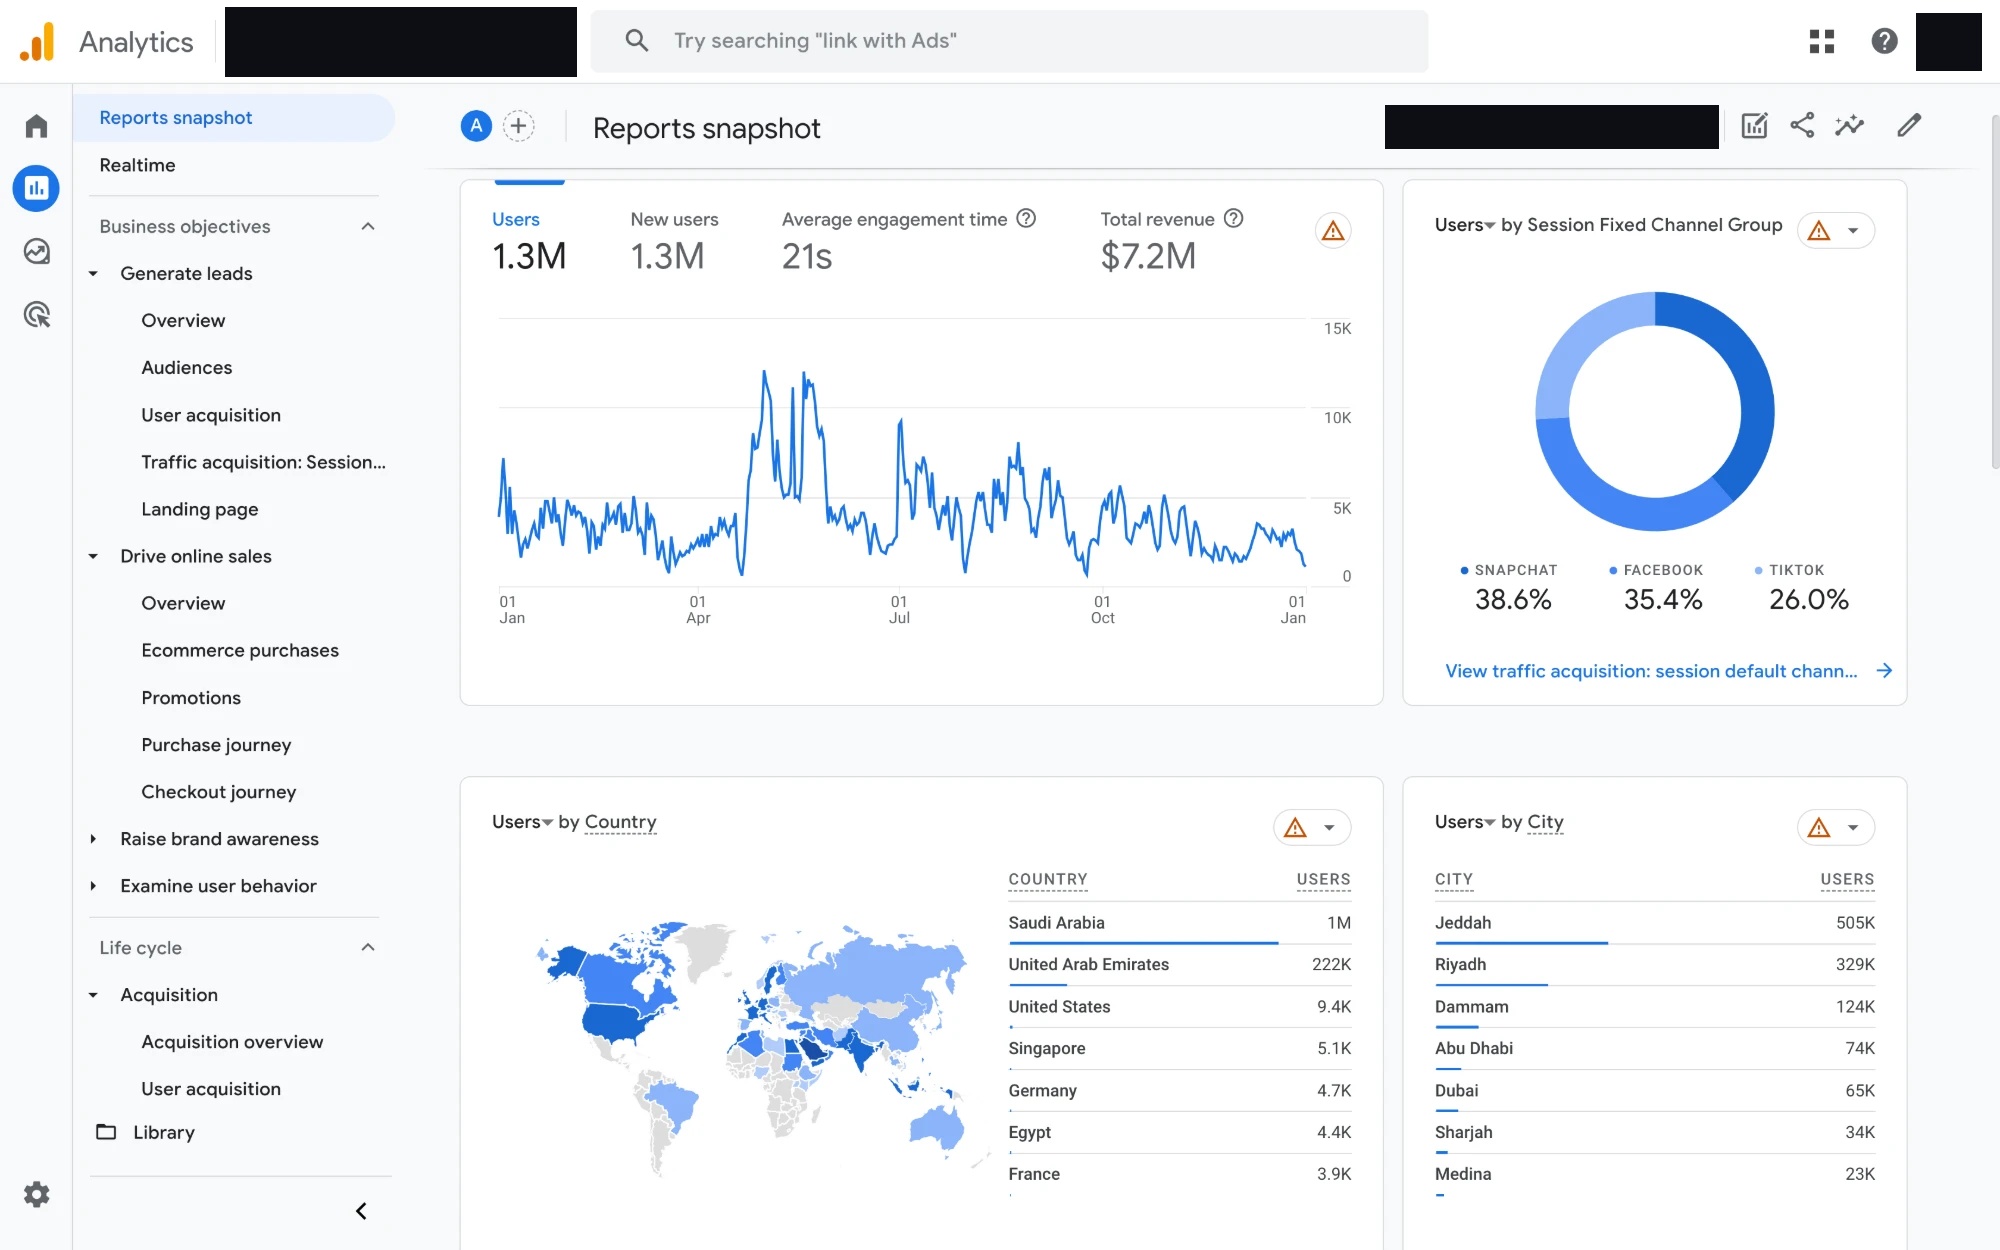
GA4 Reports snapshot: 1.3M users, 21s average engagement time, $7.2M total revenue, channel groups Snapchat 38.6%, Facebook 35.4% and TikTok 26.0%, with users by country and by city.
GA4 · 2023-01-01 → 2024-01-01Property and account names, property address, date-range chip and account avatar are covered with solid fills. The image is shown at full size and original quality.EV-GA4-1 · Open the redacted screenshot at full size

Scope and responsibilities

  1. Marketing and analytics for the property planned, run and read by me end to end, without assistants (owner-confirmed).
  2. The evidence is the property's own GA4 Reports snapshot for a one-year custom range, 1 January 2023 to 1 January 2024.
  3. Identifiers are masked; every number below is read from that screenshot.

The reading challenge

At 1.3 million users in twelve months across two markets, the useful question stops being how many people arrived. It becomes where they came from, which markets and cities carry them, and what the revenue figure can honestly be compared with. One view has to answer that before budget moves.

What the report shows

  1. Scale: GA4 counts 1.3M users and 1.3M new users for the period, so almost every visitor was new to the property.
  2. Channel mix: three channel groups account for 100% of users: Snapchat 38.6%, Facebook 35.4% and TikTok 26.0%. No platform exceeds 40%.
  3. Markets: Saudi Arabia 1M and the UAE 222K users. Every other country in the top seven is below 10K.
  4. Cities: Jeddah 505K, Riyadh 329K and Dammam 124K lead; in the UAE, Abu Dhabi 74K, Dubai 65K and Sharjah 34K.
  5. Engagement: average engagement time of 21 seconds, and GA4-reported total revenue of $7.2M for the same property and period.
Where the users came fromSession channel groups, share of users. The three groups add up to 100%.
Snapchat 38.6%Facebook 35.4%TikTok 26.0%100%of users
  • Snapchat38.6%
  • Facebook35.4%
  • TikTok26.0%
Markets by usersTop seven countries in the report. Two markets carry almost all users.
Cities by usersTop seven cities in the report.

Strategic implications

  1. No single platform carries the audience: reading Snapchat, Facebook and TikTok on one property makes them comparable like for like.
  2. Two markets hold about nine in ten users (from GA4's rounded figures), so country and city are the primary reading axes, not an afterthought.
  3. $7.2M is a visibility figure. To guide spend it must be matched with confirmed orders, returns and costs, none of which this view contains.

Verified metrics

Each figure keeps its source, period, meaning and limits. Open a card to see what it does not prove.

  1. 1
    Ad spend managedWhat was spent in the ad account. A cost, not a result.
    No verified figure yet
  2. 2
    Platform-attributed conversionsPurchases or leads the platform counts for itself, inside its own attribution window.
    No verified figure yet
  3. 3
    Analytics-reported revenueRevenue the analytics system (GA4) records. Not store accounting, not profit, not proof of which ad produced it.
    Verified
  4. 4
    Confirmed paid salesOrders confirmed or paid in the store or order system. Closer to the business.
    No verified figure yet
  5. 5
    RevenueValue of those sales before costs and returns, from the store records.
    No verified figure yet
  6. 6
    ProfitRevenue after product, delivery, returns and ad costs, from the owner financial records only.
    No verified figure yet
  7. 7
    Performance improvementA change between two comparable, non-overlapping periods on the same scope.
    No verified figure yet
Audience and scale
1.3M

Users

GA4 · 2023-01-01 → 2024-01-01 · Source: EV-GA4-1Confidence: medium
What it means and what it does not

Users GA4 counted for the property over the period (users who visited at least once).

Limits: GA4 shows this figure rounded in the screenshot. It counts people, not orders, and says nothing about revenue.

Audience and scale
1.3M

New users

GA4 · 2023-01-01 → 2024-01-01 · Source: EV-GA4-1Confidence: medium
What it means and what it does not

Users GA4 saw for the first time in the period.

Limits: GA4 shows this figure rounded in the screenshot. It shows the same rounded value as total users, so the exact gap is not visible.

Audience and scale
21s

Average engagement time

GA4 · 2023-01-01 → 2024-01-01 · Source: EV-GA4-1Confidence: medium
What it means and what it does not

GA4's average engagement time as shown in the report.

Limits: The screenshot does not show how the average is computed or per which unit; read it as GA4's own definition.

Analytics-reported revenue
$7.2M

GA4-reported total revenue

GA4 · 2023-01-01 → 2024-01-01 · Source: EV-GA4-1Confidence: medium
What it means and what it does not

Total revenue as GA4 reports it for the whole property and period. It is the analytics system's figure, not store accounting, not profit, and not revenue proven to come from any one ad or channel.

Limits: No revenue split by channel is visible, so this figure is not attributed to any ad or channel here. The card carries a GA4 warning icon whose cause is not visible. GA4 shows this figure rounded in the screenshot.

Measurement limitations

  • Total revenue is GA4's own figure. It is not profit, not net of costs or returns, and it is not split by channel in this screenshot, so it is not attributed to any ad.
  • The currency symbol in the screenshot is $; the owner confirms it is US dollars.
  • Several report cards show a GA4 warning icon whose cause is not visible in the screenshot.
  • Figures are rounded as GA4 displays them (1.3M, 1M, 222K), so differences between rounded values cannot be recovered.
  • The view contains no order counts, refunds or costs, so it cannot show conversion rate, margin or return on spend.

Related reading and services

Want this level of clarity in your own account?

Start with one strategy session: your numbers, read at the right level, and a clear next step.

Discuss your project needs